import os

from pyseter import sort
from sklearn.metrics.pairwise import cosine_similarityClustering individuals
Here we present a quick overview on how to cluster individuals with Pyseter. Clustering individuals is useful when you don’t want to match against a reference set. For example, you might want to quickly sort individuals from the field into folders of proposed IDs, such that you can quickly grade the images for quality and distinctiveness.
Pyseter comes with two ways to cluster individuals: NetworkCluster and HierarchicalCluster. NetworkCluster is most useful for smaller datasets, and should be intuitive for anyone who has worked with similarity scores before. HierarchicalCluster works better for larger datasets.
Dataset
To demonstrate clustering, we’ll use the spinner dolphin example dataset. The images in this example were collected during a multi-year photo-ID survey of spinner dolphins in Hawaiʻi. We demonstrate how to extract the features and save them for this dataset in Extracting Features. As such, we’ll load the previously saved features here.
feature_dir = 'working_dir/features'
out_path = feature_dir + '/features.npy'
filenames, feature_array = sort.load_features(out_path)
Network clustering
If an ID algorithm is calibrated correctly, then a high similarity score between two images should indicate a high probability that they contain the same individual. As such, we might define a threshold, over which we assume that two images contain the same individual. Once we compute the similarity scores between all pairs of images, we can look to see which images are “connected”, that is, which pairs of images have a similarity score over a threshold. When multiple images are connected to one another in a blob, we can consider them a proposed ID. The end result of all this is a network, where the images are the “nodes” and similarity scores over the threshold are the “edges”. The number of clusters, that is, the number of sets of nodes that have connections between them, represents the number of proposed IDs.
The number of clusters depends on the match_threshold. Low thresholds will create many connections and therefore few clusters. High thresholds will create few connections and therefore many clusters. The ideal threshold will depend on the dataset. We think 0.55 is a nice middle ground for most applications.
To do the network matching, we just need to compute the pairwise similarity between images. We will use cosine_similarity from sklearn.metrics.pairwise to do so. cosine_similarity similarity returns an \(m\) by \(m\) matrix of similarity scores where \(m\) is the number of proposed IDs.
similarity_scores = cosine_similarity(feature_array)
nc = sort.NetworkCluster(match_threshold=0.55)
results = nc.cluster_images(similarity_scores)
Following clusters may contain false positives:
['ID_0001', 'ID_0006', 'ID_0008', 'ID_0021', 'ID_0110']We can do a quick sanity check on our match threshold with report_cluster_results, which tells us how many clusters there are and which one is the largest.
network_idx = results.cluster_idx
sort.report_cluster_results(network_idx)
Found 208 clusters.
Largest cluster has 128 images.cluster_images tells us that some of the proposed IDs (i.e., clusters) might contain false positives. False positives occur when two distinct individuals are grouped within the same cluster. While we don’t know the truth, we can look for evidence of such errors. Imagine that two images looks somewhat similar to each other, and are therefore connected. But each one, in turn, looks very similar to other images. As such, the cluster looks like a barbell, with one spurious connection between two highly connected blobs. We can look for such clusters with plot_suspicious
results.plot_suspicious()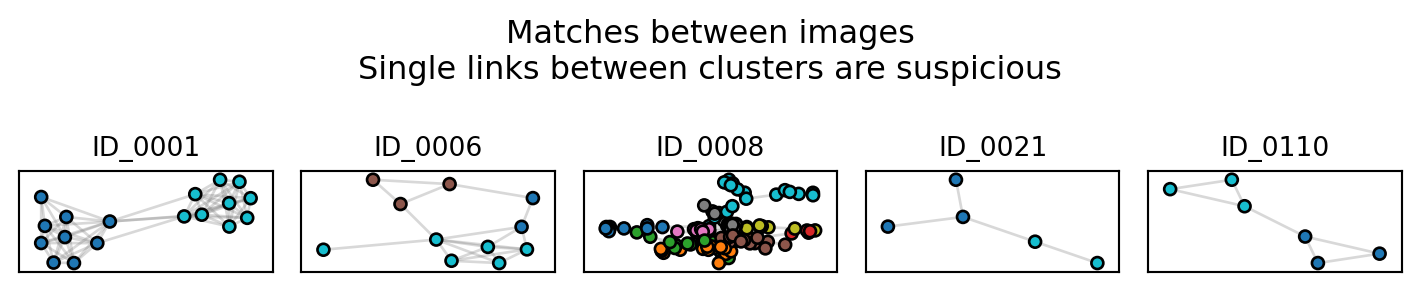
Of these, cluster ID_0001 is probably the most suspicious, and worthy of investigating. Note that dataset includes indistinct individuals, which tend to cluster together. ID_0008 most likely contains many of the indistinct individuals.
As the number of image in the dataset grows, network clustering becomes impractical because false positives and suspicious clusters will pervade. For larger datasets, we recommend hierarchical clustering
Hierarchical clustering
Hierarchical clustering works better for larger datasets. Hierarchical clustering works by clustering feature vectors together with a dendrogram. You can read more about hierarchical clustering in the scikit-learn user guide, which has a thorough guide to clustering algorithms. Pyseter’s HierarchicalCluster is a wrapper for scikit-learn’s implementation
We recommend setting the match_threshold threshold slightly lower for HierarchicalCluster, e.g., 0.5
hc = sort.HierarchicalCluster(match_threshold=0.5)
hac_idx = hc.cluster_images(feature_array)

# format_ids converts the integer labels to something like 'ID-0001'
hac_labels = sort.format_ids(hac_idx)
sort.report_cluster_results(hac_labels)
Found 299 clusters.
Largest cluster has 27 images.We see that HierarchicalCluster produces more clusters, i.e., more proposed IDs. As such, expect HierarchicalCluster to be much sparser in most cases.